Abstract
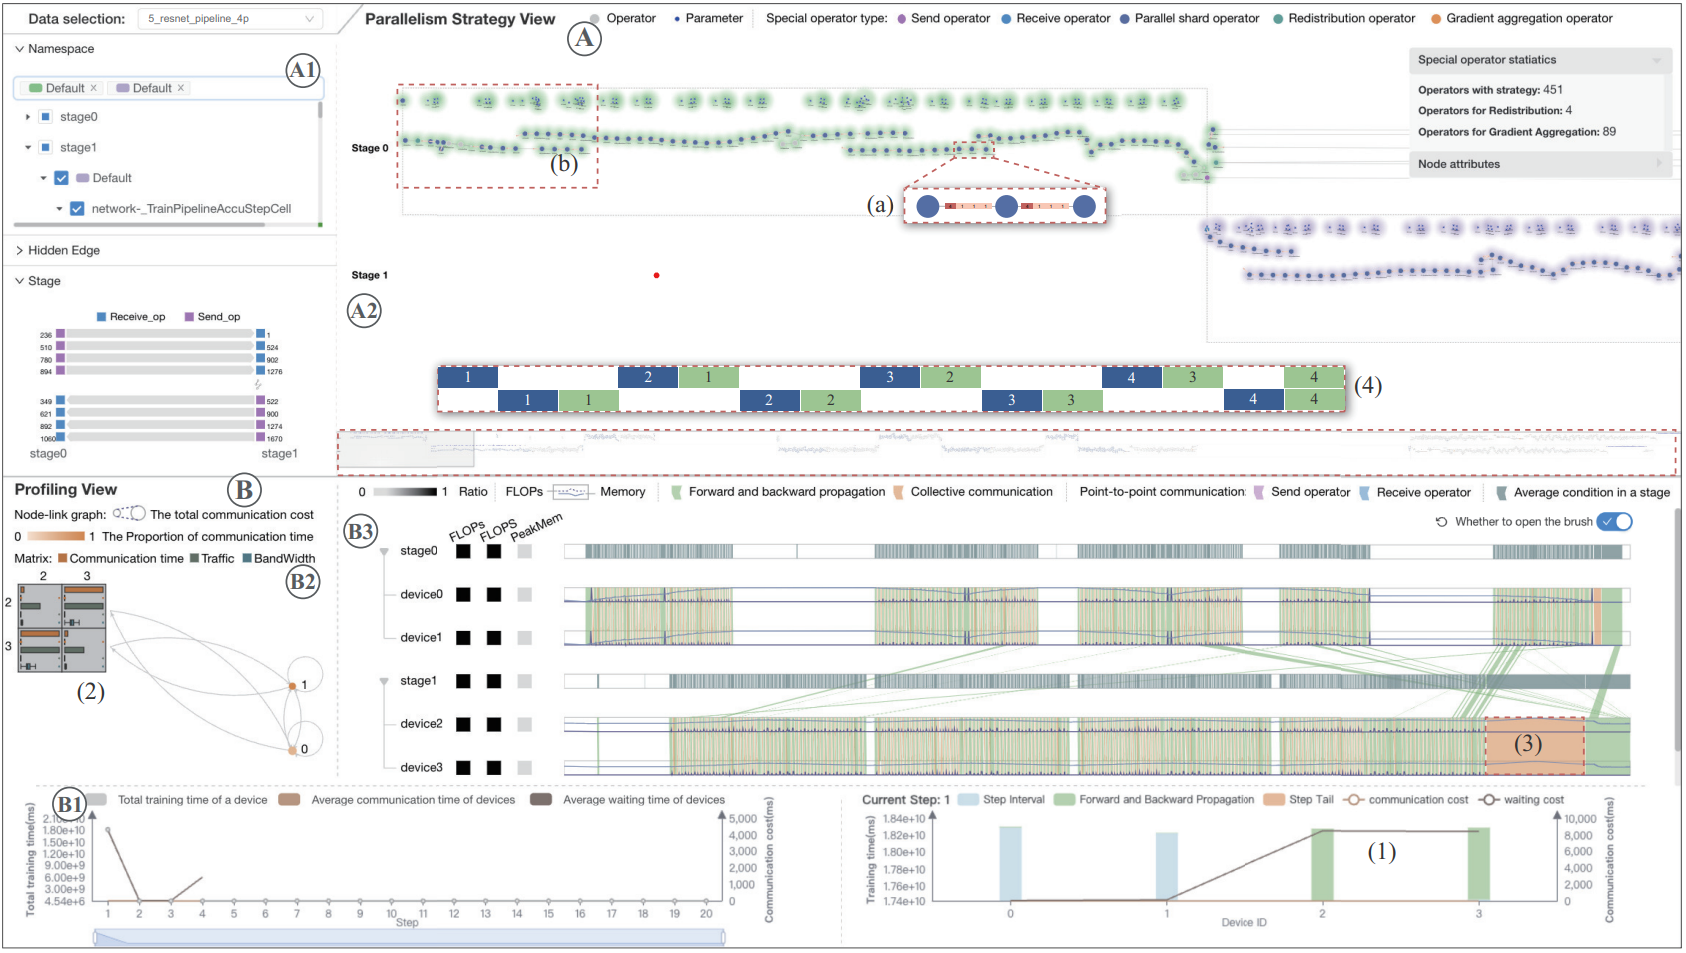
Diagnosing the cluster-based performance of large-scale deep neural network (DNN) models during training is essential for improving training efficiency and reducing resource consumption. However, it remains challenging due to the incomprehensibility of the parallelization strategy and the sheer volume of complex data generated in the training processes. Prior works visually analyze performance profiles and timeline traces to identify anomalies from the perspective of individual devices in the cluster, which is not amenable for studying the root cause of anomalies. In this paper, we present a visual analytics approach that empowers analysts to visually explore the parallel training process of a DNN model and interactively diagnose the root cause of a performance issue. A set of design requirements is gathered through discussions with domain experts. We propose an enhanced execution flow of model operators for illustrating parallelization strategies within the computational graph layout. We design and implement an enhanced Marey’s graph representation, which introduces the concept of time-span and a banded visual metaphor to convey training dynamics and help experts identify inefficient training processes. We also propose a visual aggregation technique to improve visualization efficiency. We evaluate our approach using case studies, a user study and expert interviews on two large-scale models run in a cluster, namely, the PanGu-α 13B model (40 layers), and the Resnet model (50 layers).
