RankExplorer: Visualization of Ranking Changes in Large Time Series Data.
RankExplorer: Visualization of Ranking Changes in Large Time Series Data.
Abstract
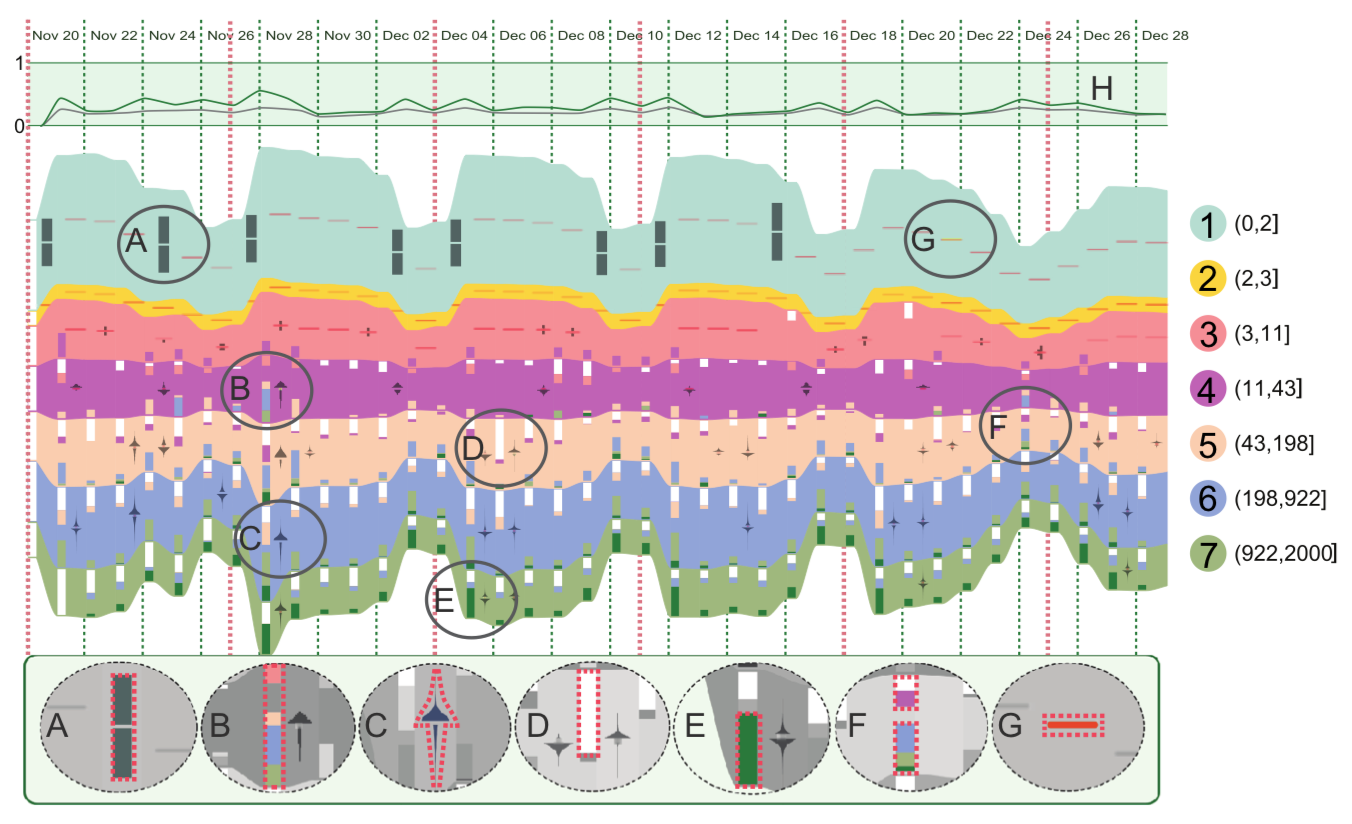
For many applications involving time series data, people are often interested in the changes of item values over time as well as their ranking changes. For example, people search many words via search engines like Google and Bing every day. Analysts are interested in both the absolute searching number for each word as well as their relative rankings. Both sets of statistics may change over time. For very large time series data with thousands of items, how to visually present ranking changes is an interesting challenge. In this paper, we propose RankExplorer, a novel visualization method based on ThemeRiver to reveal the ranking changes. Our method consists of four major components: 1) a segmentation method which partitions a large set of time series curves into a manageable number of ranking categories; 2) an extended ThemeRiver view with embedded color bars and changing glyphs to show the evolution of aggregation values related to each ranking category over time as well as the content changes in each ranking category; 3) a trend curve to show the degree of ranking changes over time; 4) rich user interactions to support interactive exploration of ranking changes. We have applied our method to some real time series data and the case studies demonstrate that our method can reveal the underlying patterns related to ranking changes which might otherwise be obscured in traditional visualizations.