Abstract
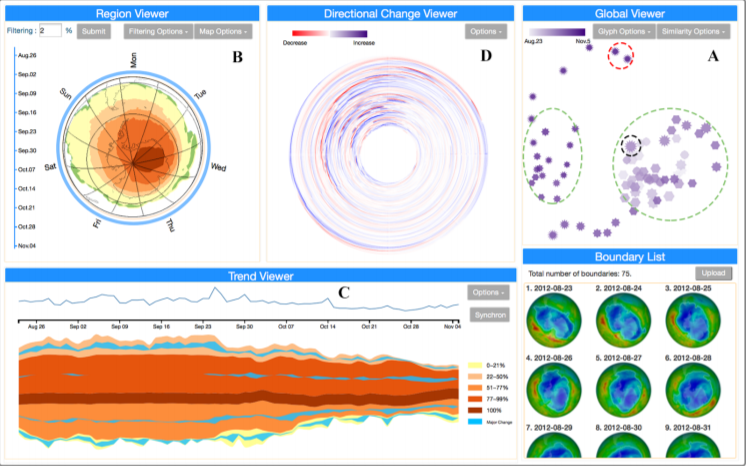
Boundary changes exist ubiquitously in our daily life. From the Antarctic ozone hole to the land desertification, and from the territory of a country to the area within one-hour reach from a downtown location, boundaries change over time. With a large number of time-varying boundaries recorded, people often need to analyze the changes, detect their similarities or differences, and find out spatial and temporal patterns of the evolution for various applications. In this paper, we present a comprehensive visual analytics system, BoundarySeer, to help users gain insight into the changes of boundaries. Our system consists of four major viewers: 1) a global viewer to show boundary groups based on their similarity and the distribution of boundary attributes such as smoothness and perimeter; 2) a region viewer to display the regions encircled by the boundaries and how they are affected by boundary changes; 3) a trend viewer to reveal the temporal patterns in the boundary evolution and potential spatio-temporal correlations; 4) a directional change viewer to encode movements of boundary segments in different directions. Quantitative analyses of boundaries (e.g., similarity measurement and adaptive clustering) and intuitive visualizations (e.g., density map and ThemeRiver) are integrated into these viewers, which enable users to explore boundary changes from different aspects and at different scales. Case studies with two real-world datasets have been carried out to demonstrate the effectiveness of our system.